 EMODnet Product Catalogue
Marine habitat mapping
Type of resources
Available actions
Topics
Keywords
Contact for the resource
Provided by
Years
Formats
Representation types
Update frequencies
status
Scale 1:
Resolution
-
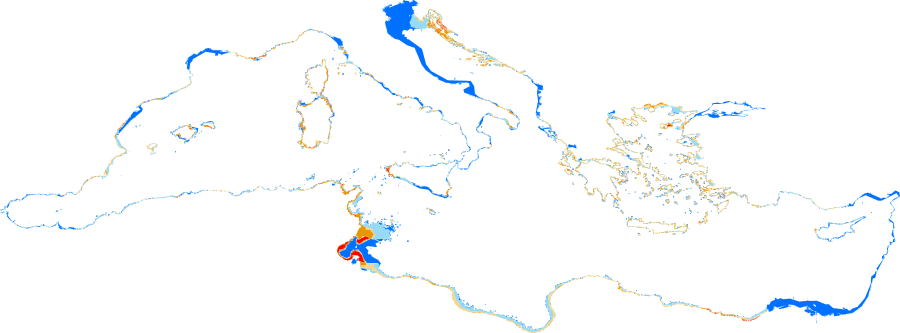
This dataset is an output of the “Mediterranean Sensitive Habitats” project (MEDISEH). It shows under a raster form modelled spatial distributions of Posidonia oceanica across the Mediterranean Sea. Posidonia oceanica is endemic to the Mediterranean Sea, where it is the dominant seagrass, covering about 50,000 km2 of coastal to offshore sandy and rocky areas down to depths of about 45 m. P. oceanica is a protected species according to EU legislation (Habitat directive), the Bern and Barcelona Conventions and several national legislations. The raster has a spatial resolution of 0.004166 decimal degrees, and the values are in the [0,1] interval (occurrence probabilities).
-
This layer was created for spatial distribution modelling of Fucus spp. in the northern Baltic Sea (Lappalanen et al, 2019). The layer represents average salinity conditions throughout the growing season, i.e. June-August values averaged over the period 2004-2015. The horizontal resolution is 20 meters. It was re-used for the EUSeaMap 2019. For further details on how it was generated: Lappalainen, J., Virtanen, E.A., Kallio, K., Junttila, S., Viitasalo, M., 2019. Substrate limitation of a habitat-forming genus Fucus under different water clarity scenarios in the northern Baltic Sea. Estuarine, Coastal and Shelf Science 218, 31ÔÇô38. https://doi.org/10.1016/j.ecss.2018.11.010
-
This layer was created for the EUSeaMap 2019. It was computed from the CMEMS product "ARCTIC OCEAN - SEA ICE CONCENTRATION CHARTS - SVALBARD" (product identifier: SEAICE_ARC_SEAICE_L4_NRT_OBSERVATIONS_011_002). Daily values were averaged over the year 2018
-
Model describes the potential distribution range of Fucus spp in the Finnish coast. Model was produced using extensive data (~140,000 samples) on the Finnish Inventory Programme for Underwater Marine Environment (VELMU). Model was built using Boosted regression trees (BRT), and resulting models describe the probability of detecting a habitat-forming species in a cell. Environmental predictors include for instance (and are not only restricted to): bathymetry, euphotic depth, salinity, substrate, and wave exposure. As more accurate information is gained by diving than from video methods, dive data was used as the primary source for modelling with 75ÔÇô90% for model training and 10ÔÇô25% for validation. The secondary source, video data, was used only for species clearly identifiable from videos with additional subsets (25%) from targeted inventories. Dive and video data are limited to rather shallow depths (typically 20ÔÇô30 m), leading to a situation where there are not enough samples from deep areas (below 50 m). To avoid artefacts in the models, a randomized absence dataset for areas deeper than 50 m was used during the modelling process. These points were used only as absences in macrophytes models, based on the knowledge that macrophytes do not live at such depths in the Baltic Sea due to habitat constraints and lack of light.
-
Model describes the potential distribution range of Potamogeton perfoliatus in the Finnish coast. Model was produced using extensive data (~140,000 samples) on the Finnish Inventory Programme for Underwater Marine Environment (VELMU). Model was built using Boosted regression trees (BRT), and resulting models describe the probability of detecting a habitat-forming species in a cell. Environmental predictors include for instance (and are not only restricted to): bathymetry, euphotic depth, salinity, substrate, and wave exposure. As more accurate information is gained by diving than from video methods, dive data was used as the primary source for modelling with 75ÔÇô90% for model training and 10ÔÇô25% for validation. The secondary source, video data, was used only for species clearly identifiable from videos with additional subsets (25%) from targeted inventories. Dive and video data are limited to rather shallow depths (typically 20ÔÇô30 m), leading to a situation where there are not enough samples from deep areas (below 50 m). To avoid artefacts in the models, a randomized absence dataset for areas deeper than 50 m was used during the modelling process. These points were used only as absences in macrophytes models, based on the knowledge that macrophytes do not live at such depths in the Baltic Sea due to habitat constraints and lack of light.
-
Model describes the potential distribution range of Zostera marina in the Finnish coast. Model was produced using extensive data (~140,000 samples) on the Finnish Inventory Programme for Underwater Marine Environment (VELMU). Model was built using Boosted regression trees (BRT), and resulting models describe the probability of detecting a habitat-forming species in a cell. Environmental predictors include for instance (and are not only restricted to): bathymetry, euphotic depth, salinity, substrate, and wave exposure. As more accurate information is gained by diving than from video methods, dive data was used as the primary source for modelling with 75ÔÇô90% for model training and 10ÔÇô25% for validation. The secondary source, video data, was used only for species clearly identifiable from videos with additional subsets (25%) from targeted inventories. Dive and video data are limited to rather shallow depths (typically 20ÔÇô30 m), leading to a situation where there are not enough samples from deep areas (below 50 m). To avoid artefacts in the models, a randomized absence dataset for areas deeper than 50 m was used during the modelling process. These points were used only as absences in macrophytes models, based on the knowledge that macrophytes do not live at such depths in the Baltic Sea due to habitat constraints and lack of light.
-
Model describes the potential distribution range of Mytilus trossulus x edulisin the Finnish coast. Model was produced using extensive data (~140,000 samples) on the Finnish Inventory Programme for Underwater Marine Environment (VELMU). Model was built using Boosted regression trees (BRT), and resulting models describe the probability of detecting a habitat-forming species in a cell. Environmental predictors include for instance (and are not only restricted to): bathymetry, euphotic depth, salinity, substrate, and wave exposure. As more accurate information is gained by diving than from video methods, dive data was used as the primary source for modelling with 75ÔÇô90% for model training and 10ÔÇô25% for validation. The secondary source, video data, was used only for species clearly identifiable from videos with additional subsets (25%) from targeted inventories. Dive and video data are limited to rather shallow depths (typically 20ÔÇô30 m), leading to a situation where there are not enough samples from deep areas (below 50 m). To avoid artefacts in the models, a randomized absence dataset for areas deeper than 50 m was used during the modelling process. These points were used only as absences in macrophytes models, based on the knowledge that macrophytes do not live at such depths in the Baltic Sea due to habitat constraints and lack of light.
-
Raster showing the number of MERIS images that were used to derive KDPAR values for each pixel. Data was collected by the MERIS satellite between 2005 and 2009 and created for use in the 2016 EUSeaMap, but updated in 2018 in order to cover Iceland and the Barents Sea and used in EUSeaMap 2019. Datasets spatial extent covers European Seas including the Azores and Canary Islands, but excluding the eastern Baltic. Created by the EMODnet Seabed Habitats consortium using data from the European Space Agency MERIS instrument.
-
Raster showing the number of MERIS images that were used to derive PAR values for each pixel. Data was collected by the MERIS satellite between 2005 and 2009 and this layer was created for use in the 2019 EUSeaMap and updated in 2018 in order to cover Iceland and the Barents Sea. Datasets spatial extent covers European Seas including the Azores and Canary Islands, but excluding the eastern Baltic. Created by the EMODnet Seabed Habitats consortium using data from the European Space Agency MERIS instrument.
-
Fraction of surface light reaching the seabed (Fr), values between 0 and 1. Derived from KDPAR and depth rasters (EMODnet bathymetry 100m DTM, 2019) using the following equation; Fr = e^-KDPAR*depth Datasets spatial extent covers European Seas including the Azores and Canary Islands, but excluding the eastern Baltic.